


















Blueprint your revenue system like an architect blueprints a house.
See every platform, process, and handoff mapped visually.

The Systems Automation Engagements (SAE) Map reveals how your business actually operates. Most companies can’t answer: “Where does data break between Marketing and Sales?” or “Why do Operations build the wrong thing?” SAE shows you the answer — every system, every workflow, every gap highlighted in one visual map.

System Automation Engagements (SAE)

Visualize how your systems truly connect, revealing where data flows, stalls, or gets lost between teams.

Stop losing deals in the handoff between Sales, Ops, and CS. QDF moves data and triggers actions between systems instantly.

Your sales team closes a deal. Finance doesn’t see it for 3 days. Operations builds the wrong thing. Customer Success never gets the handoff. Quick Data Flow (QDF) fixes this — data flows between systems in real-time, without custom code that breaks when platforms update.

Workflow Automation

Turn every manual process into motion — connect systems, trigger actions, and let automation carry your revenue forward.

When every system tells a different story, nobody can make confident decisions. CDHS unifies CRM, ERP, Finance, and Ops into one real-time data layer and Single Source of Truth.

Your CRM says one thing. ERP says another. Finance is running reports from spreadsheets. Nobody trusts the data. The Centralized Data Hub System (CDHS) is your Single Source of Truth (SSOT) — real-time sync across every platform, governed data, and one unified view that actually works.

CDHS: How it Works?

Bring your data together in one place. It’s built to sync in real-time, link, and deliver insights you can use tomorrow.

Pre-built campaign automation kits, deploy customer engagement workflows without custom development.

Automation Campaigns Creator (ACC) provides pre-built engagement workflow kits designed to address specific areas of revenue leakage. Each ACC KIT includes campaign architecture, automation sequences, and multi-channel touchpoints — ready to deploy without custom development.

Automation Campaigns Creator (ACC)

Transform your Customer Engagement Journey with ACCs’ KITs intuitive automation tools.

Capture Decisions, Assign Tasks, and Keep Work Moving Without Manual Follow-Ups

Teams leave meetings with good intentions, but follow-through breaks down. Notes scatter across Slack. Action items disappear into documents. TALK-to-TASKS closes the execution gap — turn meeting recordings into correctly routed tasks automatically.

How TALK-to-TASKS Works?

Routing conversations from meetings with two clicks into the right place to the right person on your Project Tool.

Connecting systems is a solved problem. Governing the decisions inside them is not. The Decision Routing Cockpit is where the rules that run your revenue business finally live in one governed layer.

Right now those rules live in four places at once. A workflow no one owns, a spreadsheet no one updates, a script only one contractor reads, and the head of the person who remembers. The Decision Routing Cockpit (DRC) pulls all of them into one governed layer, with global defaults, per-case overrides, and every change audited six ways.

How Does It Work?

Every rule your revenue business runs on becomes named, scoped, and auditable. By the business, without a developer touching code.

Data Flow Architecture Design

Built from your SAE Map, we design workflows that connect systems and trigger the right actions at the right time.

Integration Path Selection

We choose the optimal path—native connectors, APIs, iPaaS (Make, Workato), or N8N—for reliable, scalable data flow.

Team Training & Documentation

We onboard your team, document workflows, and ensure everyone knows how the system works.

We design and build QDFs that move data and trigger actions across your systems in real-time.

You need workflows that don’t break when platforms update. We implement Quick Data Flows using your SAE Map as the blueprint—connecting CRM, ERP, operations, and finance so every action flows automatically without custom code that breaks on the next update.

CDHS Architecture Design

Built from your SAE Map, we design the central hub that connects all systems and establishes your single source of truth.

Master Data Management (MDM)

We establish control and accuracy across every record, ensuring clean, consistent, reliable data everywhere.

Data Governance & Flow Rules

We define ownership, validation rules, and automated flow logic to keep your data clean as it scales.

We implement CDHS so every system, report, and decision runs from one source of truth.

When CRM, ERP, Finance, and Operations all tell different stories, nobody can make confident decisions. We build your Centralized Data Hub System using your SAE Map to define data ownership, flow rules, and governance—so you finally have one real-time view that everyone trusts.

Campaign Strategy & Journey Mapping

We map your customer journey, identify engagement gaps, and design campaigns that address specific revenue leakage points.

Multi-Channel Workflow Design

We design coordinated workflows across email, SMS, in-app messaging, and sales triggers for unified engagement.

Campaign Launch & Optimization

We build, test, launch, and continuously optimize your campaigns for maximum conversion and engagement.

We design and deploy multi-channel engagement campaigns using ACC templates—customized for your customer journey.

Generic email sequences don’t work. We build Automation Campaign Creator (ACC) workflows tailored to your specific revenue leakage points—combining email, SMS, in-app, and sales triggers across HubSpot, Klaviyo, and your CRM to drive engagement that converts.

Integration Architecture & Path Design

Selecting the optimal path for seamless, scalable data flow across Departments.

Custom Implementation & Config

From simple plug-ins to advanced cross-system builds, we tailor each setup to your business logic.

Mastering Seamless Migration & Implementation Systems

Your new tools integrate smoothly, align with your workflows, and start delivering value from day one.

We don't just connect systems, we make them work in harmony. Fruition designs, builds, and implements integrations that keep your operations flowing without friction.

Most integrations are duct-taped APIs that break when platforms update. We design integration architecture for the long term—selecting the optimal path through native connectors, APIs, N8N, or iPaaS like Make or Workato.

15-minute conversation that reveals where your revenue system breaks — gaps, silos, missed handoffs mapped visually.

Most companies can’t answer basic questions: “Where does our sales data break?” “Why doesn’t Operations know what Marketing promised?” The SAE Diagnostic reveals your answer in 15 minutes — a visual map showing exactly where systems disconnect, data gets lost, and revenue leaks.

System Automation Engagements (SAE)

Visualize your business blueprint. See every system, process, and touchpoint in one place.

Stop Revenue Leakage

Find and fix the invisible cracks draining your time, money, and margins — before they turn into growth barriers.

Preventing your Data Silos — Get your SSOT

Centralize scattered data and replace confusion with clarity, ensuring every department works from one truth of data and build your single source of truth (SSOT).

Process Mapping & Documentation

We map how work truly gets done across RevOps, Production, and Operations — turning chaos into structured processes.

SOP Design for Automation Readiness

Every SOP is built with automation in mind, ensuring systems and people work together. Not against each other.

Adoption & Change Enablement

We don't just document; we drive adoption. Teams learn how to follow, improve, and trust the process, turning SOPs into muscle memory.

Transform tribal knowledge into repeatable workflows, giving your teams the structure to scale with clarity and consistency.

Automation breaks and centralization stalls when teams work from memory instead of process. We map how work truly gets done — turning SOPs into muscle memory, not shelfware.

Team Training & Enablement

Hands-on training sessions tailored to your team's roles, ensuring everyone uses new systems confidently from day one.

Adoption Measurement & Optimization

Track adoption metrics, identify blockers, and continuously optimize workflows to ensure your team actually uses what you built.

Gold Partner Implementation Support

We're Gold Partners with HubSpot, Monday.com, and Segment — meaning we bring certified expertise to every implementation.

We don't just hand over systems — we onboard your team, train them to use tools confidently, and ensure adoption sticks.

New systems fail when teams don’t adopt them. We train, enable, and support your team through the transition. As Gold Partners with HubSpot, Monday.com, and Segment, we know how to make systems work for your people.

RevOps Strategy & System Architecture

We align your go-to-market strategy with your tech stack, designing the operational backbone that connects Marketing, Sales, and CS.

Performance & Optimization with Automation Support by AI agent

Our consultants analyze your funnel, uncover hidden inefficiencies, and rebuild your operations for precision, speed, and scalability.

Tech Stack Alignment & Implementation

From HubSpot and NetSuite to Monday.com and Shipwell, we integrate and orchestrate your tech ecosystem into one coordinated revenue engine.

Strategic advisory for revenue operations — system architecture, automation strategy, data governance, and team enablement.

RevOps isn’t just about connecting systems — it’s about aligning strategy, data, and execution. Our consultants bring two decades of experience building revenue engines for $50M-$500M companies.

The LET DATA FLOW™ Framework

Fruition RevOps’ proven framework turns disconnected systems into synchronized revenue engines. Each stage reveals where your data, workflows, and teams fall out of sync, and rebuilds them into one intelligent flow that drives efficiency, visibility, and growth.
Four stages that guarantee smooth process alignment

1

Diagram Your SAE Map

Map how your business actually operates across teams, capturing the customer journey, decision points, system roles, data handoffs, and revenue flow. This blueprint surfaces inefficiencies and defines what must be automated versus redesigned.

2

Map Your Data & Automation Attributes

Translate the SAE blueprint into a concrete data flow and automation model — defining system ownership, data attributes, relationships, and trigger logic. This prepares your foundation before building QDFs.

3

Centralize the Flow (CDHS)

Implement the Centralized Data Hub System as the governance layer connecting all systems and QDFs. CDHS enforces data ownership, flow rules, and establishes a single source of truth — ensuring automation stays stable as you scale.

4

Build & Execute Data Flow (QDF)

Deploy targeted Quick Data Flows that move data and trigger actions across systems in real time. Each QDF handles a specific business event — deal progression, order creation, production updates, billing changes — without manual intervention.

Manufacturing

Sync production schedules, inventory, and order fulfillment across ERP, CRM, and operations.

Healthcare

Connect patient data, billing, and care coordination across EMR, RCM, and operations systems.

Technology

Align product, engineering, sales, and customer success with real-time data across tools.

Consumer Services

Unify ticketing, CRM, and knowledge bases to deliver seamless customer experiences at scale.

Retail

Connect POS, inventory, e-commerce, and fulfillment for real-time visibility across channels.

Franchisors

Centralize franchise operations, royalty tracking, and performance reporting across locations.

Agencies

Sync project management, client billing, and team capacity across tools for better margins.

Investments

Unify portfolio tracking, deal flow, and LP reporting for complete investment oversight.

Meet Our Team

The automation architects, data specialists, and RevOps consultants behind Fruition.

Our History

Two decades transforming disconnected systems into unified revenue engines.

Partner With Fruition

Join our network of agencies and consultants implementing Fruition frameworks.

Our Philosophy

Where technology meets process—aligning Platforms, People, Processes, and Insights.

Resources & Learning

Latest Blog Posts

Stay current with RevOps insights and automation strategies

VideoTube Channel

Watch automation tutorials and implementation guides

Free RevOps Evaluation

Assess your revenue operations maturity

ACC Templates

Pre-built automation campaign kits ready to deploy

Framework Guide

Learn the Let Data Flow methodology step-by-step

Contact Our Team

Talk to automation architects about your systems

Case Studies

Real implementations with measurable results

Tools & Calculators

Revenue Leakage Calculator and diagnostic tools

Start Here Page

Not sure where to begin? We’ll guide you.

Why Data Flow

Most RevOps fixes treat the symptom. This is how we fix the operating model underneath.

Data Leakage Calculator

Find out how much revenue your business is losing and exactly where it’s slipping through the cracks.

Pricing

Every engagement follows a logical journey. Here’s where it starts.

SAE Architecture Map

Find where your revenue is breaking — every engagement starts here. We map your systems, identify leakage points, and show you exactly what to fix first.

Who Offers ERP Implementation With Automated Reporting and Analytics?

Enterprise resource planning (ERP) implementation with built-in reporting and analytics is offered by NetSuite, SAP, Microsoft Dynamics 365, Oracle Fusion Cloud ERP, Acumatica, Sage Intacct, and Infor. It’s available either through the vendor’s own services group or through certified partners. All seven ship dashboards and reports with the base product. How much of that reporting runs automatically, who builds it during the project, and what it costs beyond the license differs more than the feature lists suggest.
An ERP system is the system of record for finance, purchasing, inventory, and often order management. An ERP implementation is the project that configures it, moves the old data in, and puts the first reports on screen. Those reports can only describe what the ERP holds. Revenue starts in a customer relationship management (CRM) system, a quoting tool, or a billing platform, so the numbers leadership asks about most often depend on data that was never part of the ERP project.
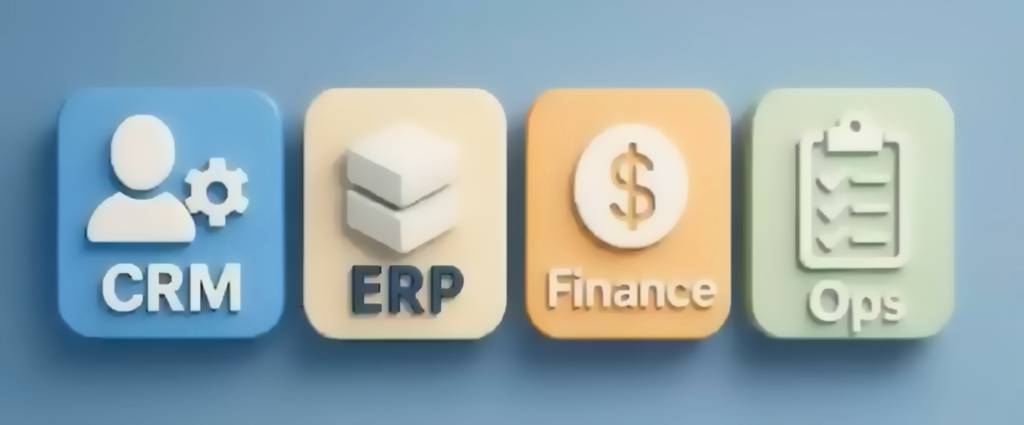
ERP implementation with automated reporting connects CRM, ERP, finance, and operations data

ERP Implementation Providers and the Reporting Each One Ships

Every provider below sells ERP implementation with reporting attached. They sort into three delivery models, and the model decides who builds your first reports.
ProviderDelivery modelReporting that ships with it
NetSuiteVendor-led, through SuiteSuccessRole-based dashboards, KPIs, and reports in industry editions, with an analytics warehouse sold as an add-on
InforVendor-led, through Infor Time to ValueBirst analytics alongside CloudSuite, licensing not stated
SAPFramework-led, through GROW with SAPEmbedded analytics in the Fiori apps, with SAP Analytics Cloud sold separately
Microsoft Dynamics 365 FinanceFramework-led, delivered by partnersBusiness performance analytics in the Finance license, with data limits
Oracle Fusion Cloud ERPFramework-led, delivered by partnersOTBI for operational reports and Fusion Data Intelligence for dashboards
AcumaticaPartner-led, through resellersDashboards, Report Designer, Generic Inquiries, and Power BI over OData
Sage IntacctPartner-led, with Sage experts recommendedHundreds of reports, a Financial Report Writer, and role-based dashboards

Vendor-Led Delivery From NetSuite and Infor

NetSuite delivers through SuiteSuccess, which it describes as a customer lifecycle methodology built on preconfigured, fixed-fee solutions that go live in a predictable time frame. The page gives no week count, so ask for one in writing. Its industry editions arrive with role-based dashboards, key performance indicators (KPIs), and reports already set up, and deeper analysis runs through SuiteAnalytics Workbook. NetSuite Analytics Warehouse, a prebuilt cloud data warehouse for heavier analysis, is sold as an add-on module.

Infor leads implementations with its own Global Professional Services organization and a methodology called Infor Time to Value. That process opens with a Value Journey Workshop before anything is signed. Its Birst analytics product works alongside the CloudSuite lineup. Infor’s pages don’t say whether Birst comes with the ERP license or is priced on its own.

Framework-Led Delivery From SAP, Microsoft, and Oracle

SAP runs its ERP implementation through GROW with SAP, a methodology for the product it now calls SAP Cloud ERP. SAP says initial scope can be delivered in 30 days or less, with a footnote that activation time may vary, so read that as a best case. Embedded analytics run inside the Fiori apps, where finance users build their own queries, KPIs, and reports. Standalone SAP Analytics Cloud sits beyond that and is a separate product.
Microsoft Dynamics 365 Finance follows a framework called Success by Design. Microsoft’s own FastTrack program helps customers get started but, in Microsoft’s words, has no formal role on the project. Partners and the customer carry out the ERP implementation itself, so the quality of your reports depends heavily on who you hire. Business performance analytics is included in the Dynamics 365 Finance license and connects to Power BI. It currently reports on up to eight quarters of data, within the storage limits of a Power BI Embedded capacity tier.
Oracle Fusion Cloud ERP splits reporting in two. Oracle Transactional Business Intelligence, called OTBI, handles day-to-day operational reports inside the application. Oracle Fusion Data Intelligence adds role-based finance dashboards and wider analysis. Oracle also offers a guided implementation platform to Fusion Cloud Applications customers, now called Oracle AI Success Navigator. Oracle’s pages don’t say whether Fusion Data Intelligence is a separate subscription, which is worth settling before the contract is signed.

Partner-Led Delivery From Acumatica and Sage Intacct

Acumatica sells through value-added resellers, and those resellers handle evaluation and implementation. Reporting comes from Acumatica Dashboards, Report Designer, and Generic Inquiries, and Power BI connects over an O Data feed. The reporting you end up with depends on the reseller as much as the software.
Sage Intacct says implementation typically takes three to six months and recommends using Sage’s own experts. Its reporting includes hundreds of multi-dimensional reports and dashboards, a Financial Report Writer, and role-based views. Sage positions the product for growing organizations, typically with more than $4 million in annual revenue or more than 20 employees.
That covers the realistic range of providers worth a call. Each one can get reports on screen by go-live. The harder question is which numbers those reports can see.

Automated reports keep running on whatever definitions the project left behind.

What Automated Reporting Looks Like 90 Days After ERP Implementation

The first month after go-live is when the reports get praised. The third month is when they get questioned.

One Deal, Two Reports

A deal closes in the CRM on the last day of the month. The rep marks it won, and the sales report counts a booking. Billing waits for a signed order form. The ERP recognizes revenue under its own rules, on its own schedule. By the first week of the next month, the CRM report and the ERP report show different totals, and finance reconciles them by hand.
Both reports are accurate to the data each system holds. That is why nobody can say which one is wrong. The automated reporting delivered by the ERP implementation runs on time and shows the numbers it was given. The disagreement lives in the handoff between systems, and an ERP project is scoped around one system at a time.
That handoff is where Fruition RevOps works, alongside the ERP and the implementer. A governed data hub, the Centralized Data Hub System (CDHS), holds the rules that decide which system owns each field. Contract value comes from finance, deal stage comes from the CRM, and both reports read the same answer. Finance and sales then share one source of truth to work from.
The same split shows up between quoting and billing. A rep sends a quote with a 12 percent discount, the contract is signed at 10 percent, and the invoice goes out at list price because the final discount never reached the ERP. That leaves three documents with three different amounts, and the ERP report only sees the last one. When the deal terms move automatically from quote to cash, the ERP report starts from the amount the customer actually agreed to. If the configure, price, quote (CPQ) tool is part of the problem, the platforms worth comparing each handle that handoff differently.

Why Reports Drift After the Partner Leaves

Reports built during an ERP implementation reflect the definitions agreed in the project. Those definitions cover what counts as revenue, which customers are active, and when a deal is booked. Definitions change. A new product line, a pricing model, or a reorganization moves the line, and the automated report keeps running on the old one, faster and on a schedule.
Nobody notices until two reports disagree in a meeting. The same pattern appears in workflow platforms, where reporting can describe an ungoverned process with perfect accuracy. A report is only as current as the last person who updated its definition.

Five Questions to Put in Writing Before You Choose an ERP Implementation Provider

Reporting problems after go-live usually trace back to something nobody wrote down during the sales cycle. These questions put it on paper before the statement of work is signed.

Which Reports Are Built Before Go-Live, and Which Are Add-Ons?

The vendor pages above show how much this varies. NetSuite sells its analytics warehouse as an add-on. Microsoft includes business performance analytics in the Finance license with limits. Oracle and Infor don’t state it. Panorama Consulting’s 2026 ERP Report found that more than a quarter of organizations exceeded their project budgets, with additional technology needs named as the leading cause. An analytics add-on discovered after kickoff is exactly that kind of line item.

Who Defines Revenue, Booking, and Active Customer Before the Build?

Every automated report encodes a definition. If finance, sales, and operations have never agreed on one, the ERP implementation partner will pick a definition by default, usually whichever person answered the email first. That definition then sits inside every dashboard the project delivers. Ask for the definitions to be listed in the statement of work and signed off by the people who own each number.

What Data Comes From Outside the ERP, and How Does It Arrive?

Most executive reports blend ERP data with CRM, billing, or subscription data. Ask how each outside feed will get in, how often, and what happens when it fails. A nightly sync that breaks after a vendor update rarely shows an error on the dashboard. The revenue chart keeps loading, but with last Tuesday’s numbers, and the first person to notice is often someone preparing for a board meeting. Ask the provider to show you the alert that fires when a feed stops and to name the person who receives it. If nobody can answer, the integration layer needs its own line in the statement of work.

Who Maintains the Reports After the Partner Leaves?

The ERP implementation project ends on a date. The reports keep running long after it. Ask who inside the company can change a report, who approves the change, and whether the work is documented well enough for a new hire to follow. A report only one consultant understands carries the same risk as a spreadsheet only one person understands.

How Will the First Month's Reports Be Checked Against the Close?

The first full month-end close is the real test. Ask for an acceptance step where the ERP reports are reconciled to the general ledger and to CRM bookings, with every variance explained. A provider who agrees to that in writing has built the reports to be checked, and that tells you more than any demo.

Bring a System Map to the First Discovery Call

The most useful thing to hand an implementer before discovery is a picture of what already exists. A Systems Automation Engagement, or SAE Map charts every platform, process, and handoff in the revenue flow before anything gets built. It shows where the CRM, the billing tool, and the ERP hold the same record, and where those copies drift apart.

An implementer who sees that map scopes the ERP implementation around the real data flow and the systems that feed it. The statement of work then covers the handoffs, and the reporting plan can name where each number starts. Anyone who wants a dollar figure first can run the numbers in the Data Leakage Calculator.

Common Questions About ERP Implementation and Automated Reporting

Who Offers ERP Implementation With Automated Reporting and Analytics?
NetSuite, SAP, Microsoft Dynamics 365, Oracle Fusion Cloud ERP, Acumatica, Sage Intacct, and Infor all offer it. NetSuite and Infor lead with their own services groups. SAP, Microsoft, and Oracle publish frameworks and tooling and work with partners. Acumatica and Sage Intacct lean on resellers and partners for much of the delivery.
Vendors publish few timelines. Sage says Intacct typically takes three to six months. SAP claims 30 days or less for initial scope on its cloud ERP, with a note that activation time may vary. NetSuite promises a predictable time frame without naming one. Ask any provider for a written timeline that includes the reporting work.
It depends on the product. Microsoft includes business performance analytics with the Dynamics 365 Finance license, with data limits. NetSuite sells its analytics warehouse as an add-on module. Oracle and Infor don’t state it on their product pages, so confirm it in the contract.
For financial and operational reports that use only ERP data, the built-in tools usually cover it. Reports that combine ERP data with CRM or billing data need those feeds brought into one place first, whether that is a data warehouse or a governed hub. Either way, the business intelligence (BI) tool can only report on what reaches it.
They use different definitions, different timing, and different owners for the same deal. The CRM counts a booking when a rep marks a deal won. The ERP recognizes revenue under its accounting rules. Without a rule that says which system owns each field, both reports are correct and still disagree.

See Where Your ERP Reporting Data
Breaks Down

Before you sign an ERP implementation contract, take a closer look at how revenue data moves through the systems you already run.

Schedule a Time with our Expert!

— Fill out the Form and let's meet —

Fill out the form below to book your meeting to get your HubSpot Audit Report.

Schedule a meeting
Your HubSpot Onboarding Plan.

** Schedule to have you High level plan for free.

Funnel Types List

Register and Get the Funnel List type

Provide you with a complete overview of the type of funnel and how to manage it. 

JOIN OUR LIVE EVENT!

Wednesday, October 18th
10AM (PST)

Webinar Topic: Fix the Leak with Streamline Your Revenue Path with RevOps Funnels. 
How to seamlessly guide prospects through your company’s journey,

  1. Utilize the Funnels in Revenue Operations
  2. How to Prevent Bleeding Prospects and Customers in Your Company’s Journey
  3. How to Automate the Process for Enhanced Efficiency

RevOps Knowledge Sharing!

Fill out the form below, and blogs, videos and content will come directly to your inbox.